Go to
What is The Danish Neighborhood Atlas?
The Danish Neighborhood Atlas is a fine-grained, interactive mapping tool that provides insights into the demographic development of more than 13,000 Danish neighborhoods. The interactive map includes social and economic data from 1990-2020, provides detailed insights into neighborhood development over time, and renders possible comparisons of neighborhood developments across key demographic parameters.
The map provides insights into:
Demographics:
Neighborhood composition in terms of age, family type, and crime rates
Housing:
Sales prices, price per square meter, and the share of public housing in the neighborhood
Education:
Level of education and distance to the nearest educational institutions
Residential Mobility:
Residential mobility in and out of the neighborhood and net migration rate
Labor Market:
Income and labor market attachment
Prosperity:
An index that estimates the prosperity in a neighborhood, taking into consideration the resident’s educational level, their attachment to the labor market, their income, the number of inhabitants convicted of serious crimes, housing prices, their share of public housing, and moving patterns to and from the area
What can the tool be used for?
The Danish Neighborhood Atlas provides organizations, public authorities, and decision-makers with a tool to compare different areas and identify where local opportunities have been missing. The tool allows for comparison of regional and local development in different areas at a very detailed level. The time span of the data further makes it possible to acquire empirical insights about neighborhood development. These insights can be used to target development initiatives, plan for a better balance between urban and rural areas, and underpin the development of specific neighborhoods.
Read a selection of stories on how to use the tool under cases.
Who are the scientists behind the atlas?
The tool was developed by a project group from the Department of Built Environment at Aalborg University with support from Data.org and Splunk. The neighborhoods were created in collaboration with Two Sigma Data Clinic. The interactive mapping tool was developed in cooperation with Septima.
Project Group
Elise Stenholt Lange, PhD, post.doc, Department of the Built Environment
Malene Rudolf Lindberg, Ph.D., post.doc, Department of the Built Environment
Sixten Maximillian Thestrup, Ph.D., statistical officer, Eurostat, European Commission (The work was conducted when Sixten was a post.doc at the Department of the Built Environment)
The neighborhoods were created in collaboration with Two Sigma Data Clinic. Data Clinic is the data and tech-for-good arm of Two Sigma. They provide pro bono data science and engineering support to mission-driven organizations around the world via close partnerships that pair Two Sigma’s talent and way of thinking with their partner’s rich content-area expertise.
The interactive mapping tool was developed in cooperation with Septima. Septima specializes in products and website development that ensure optimal utilization of geodata.
Want to know more?
Do you wish to use The Danish Neighborhood Atlas in your work, or do you see potential in collaborating to develop the tool to help your organization or company? Then, please contact us on nabolagsatlas@build.aau.dk.
How were the neighborhoods created?
Creating socially and spatially meaningful granular neighborhoods is a complex process that requires striking a balance between granularity and concerns regarding data privacy regulations. Existing administrative divisions (e.g., municipalities) are either not small enough to capture local differences and population dynamics within cities or they are not necessarily meaningful from a social and built environment perspective (e.g. parishes or electoral districts).
Being socially and spatially meaningful refers to each neighborhood following the existing boundaries of the built environment, such as roads and buildings. At the same time, because the purpose of creating neighborhoods is to aggregate individual-level descriptive statistics at a fine-grained geospatial level, they should also adhere to national privacy regulations, such as minimum population counts.
Data sources
The data sources used for creating neighborhoods are:
- Open Street Maps of roads (used for district boundaries, split hierarchically into types ('fclass'):
- Major roads; highway, trunk, primary, secondary
- Minor roads; tertiary, unclassified
- Residential; residential, living street, service
- Paths; pedestrian, footway, bridleway, cycleway, track, path
- Municipality boundary data
- 100 x 100 meters grid covering all of Denmark
- Population and household counts from Statistics Denmark
Data preparation
Preprocessing data, islands with small population counts were filtered out. This implies that islands with less than 50 inhabitants are excluded from the analysis. Furthermore, the 100 x 100-meter grid cells were overlayed with municipality boundaries. Through a simple spatial union, each grid cell was assigned a municipality. Then an interpolated count for each municipality was made by considering which grid cells overlap with the municipality. If a grid cell overlapped with two municipalities, the count was split according to the percentage overlap. The result was 4.338.726 grid cells, of which 47.171 were inhabited.
Privacy regulations
Requirements from Statistics Denmark are:
- Each neighborhood should be at least 10.000 square meters.
- Each neighborhood should have at least 100 people and 50 households.
We tightened the threshold and set the minimum to 120 people and 60 households for the interpolated counts.
Algorithm
To create the neighborhoods in the Neighborhood Atlas, we have developed a hierarchical approach to algorithmically create compact neighborhoods which are adhering to privacy constraints across the whole period (1990-2020). The algorithm was developed in close collaboration with Data Clinic.
An overview of the proposed algorithm is presented in Figure 1.
Documentation of the algorithm can also be found on Github:
github.com/tsdataclinic/DenmarkRegions and github.com/thesixmax/polygone
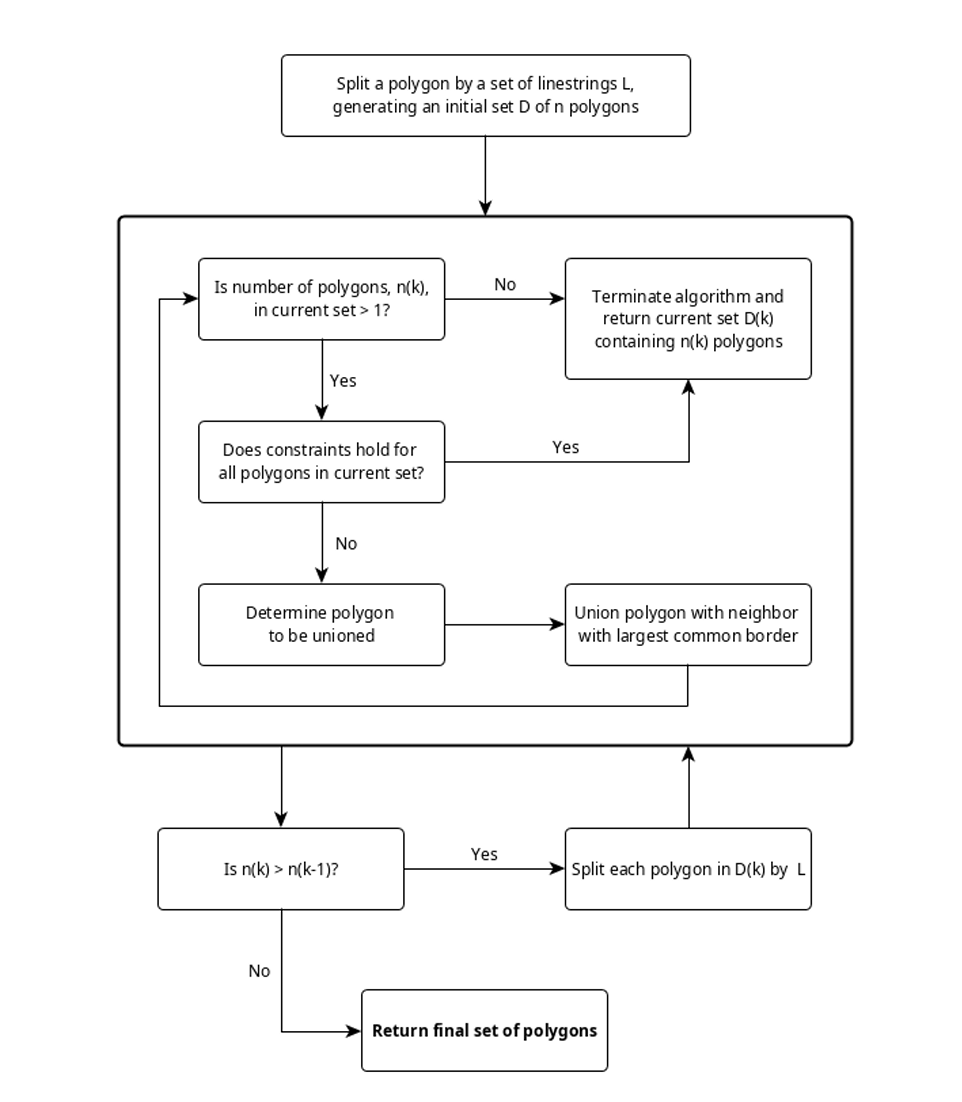
The starting point was the 98 municipalities in Denmark. The hierarchical aspect of the algorithm is to group road data according to their importance and perform a sequential iterative splitunion of an initial polygon. The chosen grouping of road types is based on the assigned OpenStreetMap fclass. The first iteration splits each municipality according to the major roads and then unions the resulting split, adhering to our chosen vector of constraints. Next, each resulting polygon was split according to the second level of roads (minor roads).
Constraints determine whether a polygon resulting from a split is unioned. They refer to both the spatial characteristics of the polygon and interpolated population counts. The constraints are:
- Minimum interpolated population count of 120
- Minimum interpolated household count of 60
- Minimum area of 1 hectare
- Not enclosed
- A certain degree of compactness as a function of interpolated population count
Following this procedure, more than 15.000 neighborhoods across 98 municipalities were initially created. To finally ensure that the privacy constraints are satisfied, the final set of polygons was mapped back onto the 100 x 100 meter grid that contains the population and household counts. Any neighborhood that potentially falls below the threshold is unioned with the neighbor that it shares the largest common border with. The result was more than 13.000 neighborhoods across the 98 municipalities in Denmark.
It is worth noting that the constraint of having at least 120 people and 60 households since 1990 within each neighborhood has the effect of making the areas larger compared to using only population counts since 2020.
Data security
All results comply with Statistics Denmark (DST) and the EU’s GDPR guidelines on data security and confidentiality. Thus, all neighborhoods in the NeighborhoodAtlas are constructed so they comply with the following requirements:
- At least 120 inhabitants in each neighborhood across all years (1990 – 2020).
- At least 60 households in each neighborhood across all years (1990 – 2020).
- Each neighborhood has a total area of at least 10,000 m2.
- In cases where data for an indicator does not comply with DST’s data security requirement, the indicator will not be shown on the map. Instead, you will see the number 0 or N/D and the category will appear grey on the map.
- In cases where data for one category of an indicator does not comply with DST’s data security requirement, and the variable is discrete, data for two categories will not be shown on the map. Instead, you will see the number 0 er N/D and the two categories will appear grey on the map.